Visualization helps Agile Teams & Organizations
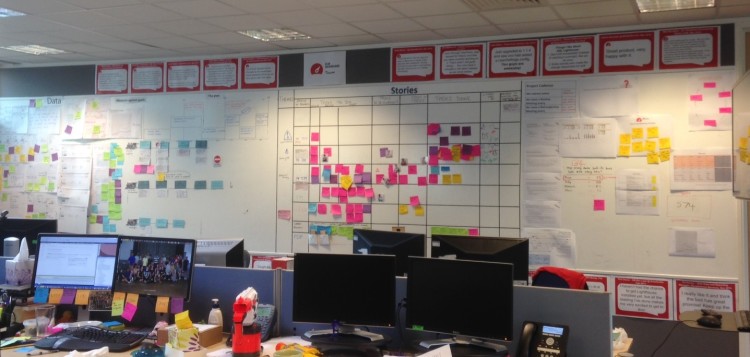
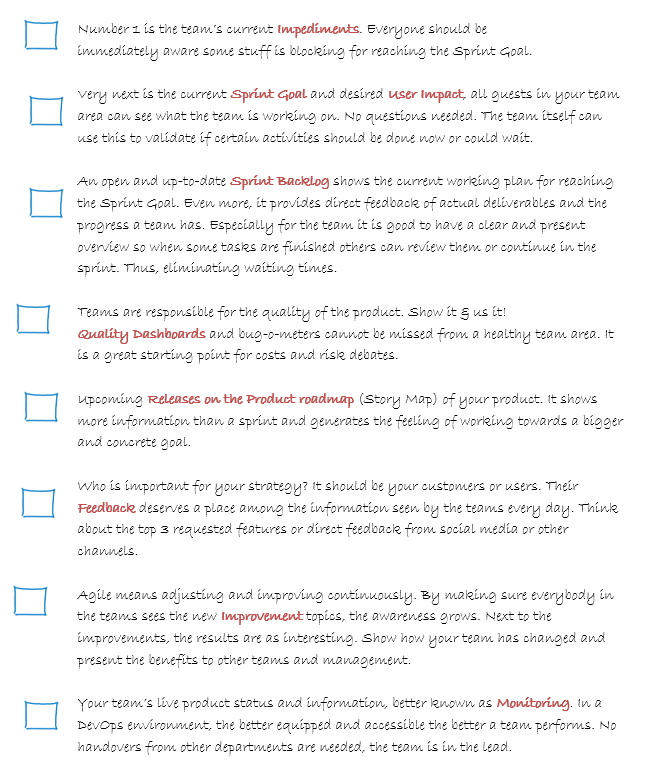
Transparency is one of the corner stones of great Agile teams and organizations. If that is the case, isn’t it strange that so many teams have little outwards visualizations? Not only teams benefit from visualization, but also management and other stakeholders could gain direct insights from the information presented. In this blog, I will discuss visualization from different perspectives using my own checklist as a starting point (see at the bottom of this blog). At the end, I will share a few pointers to get you started.
The eight examples on my checklist are a nice start. Depending on your team or department characteristics, you can probably add a dozen others. Some at least as important as the ones on the list. However, the true value for me lies in the dialogues and questions that arise from them instead of the – more fundamental – discussion on which items should or should not be on the list.
Team perspective
Let’s start with the team perspective. The first reaction and question that usually pops up is: for whom are we visualizing? Unarguably, it should be for ourselves and our stakeholders. So, if we do it for ourselves, we need to have information radiating that is important and useful for us. In my opinion, all topics on the checklist should matter to any given team. If not, there is a chance something is off in the basic way the team is functioning and/or supported by its organization. Do it, pick one topic and argue that it is not important for a healthy routine of your team.
The second reaction from teams can come from two directions: “we don’t have that information” or “it takes too much time to gather it”. Both arguments are excellent starting points for valuable discussions – during retro’s or just over coffee. Not having the information means that your team is flying in the dark. Either the product or the company’s road map is not clear or perhaps the feedback loop for continuous improvements is not implemented. If collecting these basic team drivers takes too much time, chances are that tooling is not in place or not used correctly. The reactions mentioned in this paragraph are indicators that the Way of Working can be improved.
Management perspective
Let us shift to the managerial perspective. In more Agile oriented organizations this perspective often leads to a different reaction compared to the ones above. “My teams are self-organizing, self-managing or self-supporting, so they decide what is shown and needed.” Wrong! As long as managers are responsible for their performance – either hierarchical or via a more servant-leadership – it is their job to have an interest in these subjects. If not, they’ll have a tough time explaining what added value they have for their teams and thus their organization. For example, how can a team manager not want to see Impediments or improvements made by his or her teams? In addition, teams often need directions and coaching on organizational goals and drivers. Outward visualization helps the process of aligning the organizational goals and the Way of Working of the teams.
In practice, it can be challenging to implement and decide on the most useful visualizations for your teams or department. Remember it is good to try things and ask around who is interested in what information. Or as a manager, discuss with your teams what the goal and improvements are from an organizational point of view. If done right, the information not only benefits the teams, it is also a source of information that could substitute numeral status meetings.
Stakeholder perspective
The third and last perspective is that of the stakeholders. Top priorities for stakeholders usually contain the question: “When is this or that feature finished?” By showing this information crystal clear in the team area, the team provides the stakeholders with direct insight. Moreover, it helps by building confidence and making the team predictable for its environment. Perhaps the expected date example is a bit simplified. How about this one: create a good Story map of the current product (iteration) and put it in a visible place in the area. Make sure you add significant release dates, in case you don’t go to production in every sprint yet. Now, the timeline has its own functional context which makes clear what the stakeholders can expect. For teams, it is good to adjust to the stakeholder’s needs. Thus, especially as a Product Owner you should invest in what the stakeholders would like to see and hear from the team. Also, be confident to use visualization and communication forms you have seen working before.
A few pointers to get started
Responsibility: who’s responsible for visualization? When teams just start, most of the times it is the Scrum Master who begins with Burn down charts and Impediment boards followed by other more Scrum – or process – related information. In my opinion, it should be a Scrum team effort. In other words, everybody – also the Product Owner – is using the team area to show road maps, examples or key metrics. This will stimulate the philosophy that if it is important for the team, we put it up there. Anyone can decide or try to use some new metric or insight. This does not mean that other stakeholders cannot let the team know what they would like to see.
Gemba walks: one practice that provides insights to all stakeholders is doing Gemba walks across multiple team areas. Don’t ask how things are going straight away. Instead, look around and see what the information presented is telling you. I have used this technique also with colleagues visiting other teams. Besides entertaining it is an easy mechanism to share practices and bring teams a little closer. A Gemba walk might be a catalyst for explorations on visualization benefits for teams, managers and stakeholders.
How to show: I did not elaborate on the form in which information is shown. That is on purpose. Depending on the team, tools and context, you’ll get different outcomes. The fact that I am not a great sketch artist results in more print outs for my teams. In companies with big screens available in team areas you can have as much metrics and info on the screen as you would like. In some companies on the other hand, there is a strict clean desk policy and very little information is allowed to radiate from team areas.
Conclusion
The discussions and feedback from teams and stakeholders can be as valuable as the visualizations themselves. So, make sure you are aware of their thoughts and needs before mounting all kinds of information to the walls. Depending on your role you can initiate the dialogue with or within your teams in diverse ways. Use the checklist, the Gemba walk or any another conversion-starter in your team or department to explore the benefits of visualization. I am curious to hear your experiences and/or remarks. The discussion and feedback from teams and stakeholders can be just as valuable as the visualizations themselves. So make sure you have these before you start mounting all kinds of information to the walls, or demanding this as management.

Download the one-pager: Visualization helps Teams and Organizations
Cheers,
– Sjors Meekels
References
There is a lot of information out there, so I added just a few examples to get you going:
[1] www.infoq.com: Visualize Agile https://www.infoq.com/visualize-big-picture-agile
[2] Ben Linders: Visualizations https://www.benlinders.com/visualization-team-deliver-value/
[3] www.thoughtworks.com: Story-mapping https://www.thoughtworks.com/story-mapping
[4] Toolbox for the Agile Coach – 96 Visualization examples, Jimmy Janlén, 2015
[5] Coaching Agile Teams, Lyssa Adkins, 2010
Filled Under: agile,agile projectmanagement,kanban,scrum Posted on: 1 September 2017
